Your Introduction to Microsoft GraphRAG
From local to global graphs in under 10 minutes
Introduction
Large language models (LLMs) have demonstrated remarkable capabilities in natural language understanding and generation tasks. However, their ability to directly answer questions about specific datasets is limited by the information contained in their training data and the capacity of their context window. Retrieval-augmented generation (RAG) approaches address this limitation by first retrieving relevant information from external data sources and then adding this information to the context window of the LLM along with the original query.
While effective for many tasks, existing RAG approaches face challenges when applied to global sensemaking tasks that require an understanding of entire datasets rather than specific facts or passages. In their paper, Microsoft introduces GraphRAG, a new approach that combines knowledge graph generation, RAG, and query-focused summarization. Their approach consists of the following key steps:
Indexing the source texts as a graph, with entities as nodes, relationships as edges, and claims as covariates on edges.
Detecting communities of closely related entities within this graph and generating summaries for each community.
Using these summaries as the knowledge source for a global RAG approach to answering sensemaking queries.
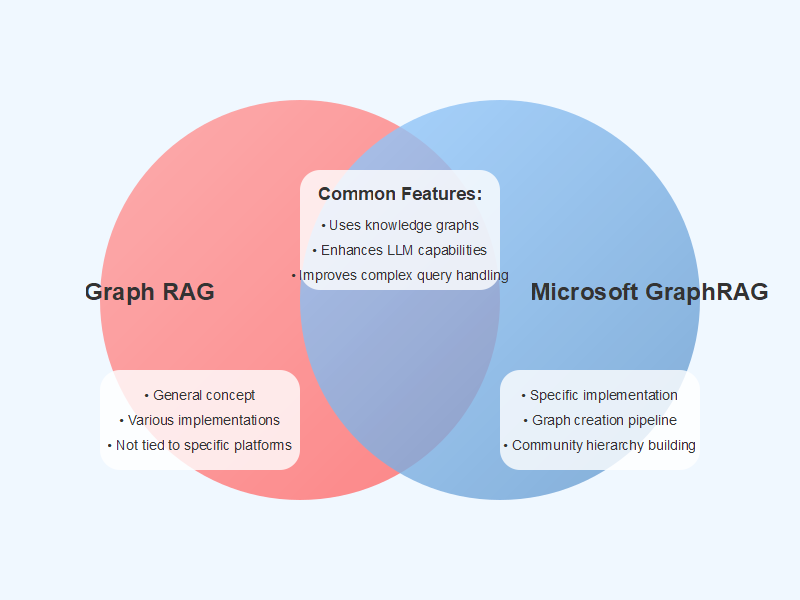
Before we dive deeper into the method, I want to make one thing clear that a lot of people seem to misunderstand: the main focus of GraphRAG is not RAG - it’s the graph construction and summarization pipeline. While the Graph RAG (graph-based RAG) part of GraphRAG is also important, most of the heavy lifting takes place before that. If you only take away one thing from this article, let it be this: Graph RAG (or graph-based RAG) is a general approach that leverages graph inputs for RAG while GraphRAG is a specific method from Microsoft. I try to make this clear in all of my content, but it’s still causing a lot of confusion.
Method
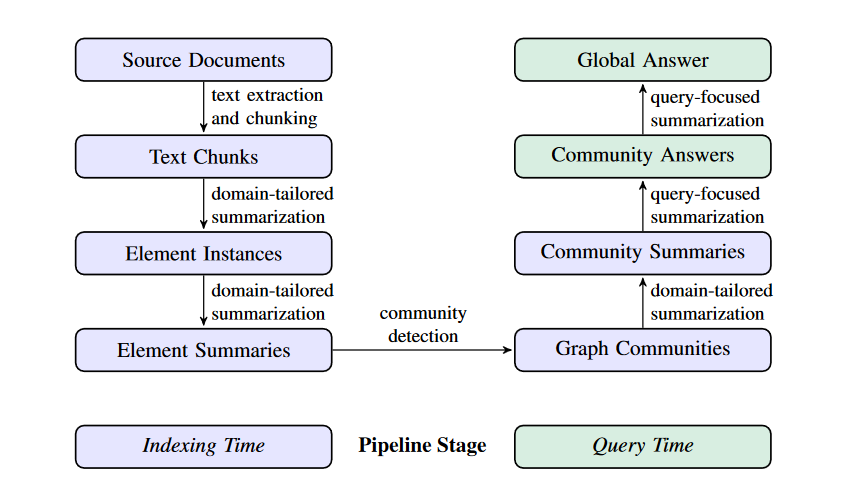
The GraphRAG workflow can be divided into 2 stages with 7 steps: the indexing stage (5 steps) and the query stage (2 steps). During indexing, documents are processed, information is extracted and graphs are created. At query time, first “local” answers are generated based on graph communities relevant to the query. The local answers are then fed as context for the “global” one (global = utilizing the full graph).
Let’s take a closer look at each of the steps and wrap our heads around it.
1. Source Texts → Text Chunks
The first step in their pipeline is to split the source texts into chunks of approximately equal size. For their experiments, they used a chunk size of 600 tokens with an overlap of 100 tokens between adjacent chunks. This enables the extraction of entities and relationships that span across chunks, while keeping chunks small enough to fit multiple chunks into the LLM's context window during graph generation.
2. Text Chunks → Element Instances
The next step is to use an LLM to extract a set of graph elements—entities, relationships, and claims—from each text chunk. They do this by prompting the LLM with a pre-query template that encourages it to identify relevant instances of each element type.
To balance the needs of efficiency and quality, they use multiple rounds of "gleanings", up to a specified maximum, to encourage the LLM to detect any additional entities it may have missed on prior extraction rounds. This is a multi-stage process in which we first ask the LLM to assess whether all entities were extracted, using a logit bias of 100 to force a yes/no decision. If the LLM responds that entities were missed, then a continuation indicating that "MANY entities were missed in the last extraction" encourages the LLM to glean these missing entities. This approach allows them to use larger chunk sizes without a drop in quality or the forced introduction of noise.
3. Element Instances → Element Summaries
The use of an LLM to "extract" descriptions of entities, relationships, and claims represented in source texts is already a form of abstractive summarization, relying on the LLM to create independently meaningful summaries of concepts that may be implied but not stated by the text itself (e.g., the presence of implied relationships). To convert all such instance-level summaries into single blocks of descriptive text for each graph element (i.e., entity node, relationship edge, and claim covariate) requires a further round of LLM summarization over matching groups of instances.
A potential concern at this stage is that the LLM may not consistently extract references to the same entity in the same text format, resulting in duplicate entity elements and thus duplicate nodes in the entity graph. However, since all closely-related "communities" of entities will be detected and summarized in the following step, and given that LLMs can understand the common entity behind multiple name variations, their overall approach is resilient to such variations given that there is sufficient connectivity from all variations to a shared set of closely-related entities.
4. Element Summaries → Graph Communities
The index created in the previous step can be modelled as an homogeneous undirected weighted graph in which entity nodes are connected by relationship edges, with edge weights representing the normalized counts of detected relationship instances. Given such a graph, a variety of community detection algorithms may be used to partition the graph into communities of nodes with stronger connections to one another than to the other nodes in the graph. In their pipeline, they use the Leiden algorithm on account of its ability to recover hierarchical community structure of large-scale graphs efficiently.
Each level of this hierarchy provides a community partition that covers the nodes of the graph in a mutually-exclusive, collective-exhaustive way, enabling divide-and-conquer global summarization.
5. Graph Communities → Community Summaries
The next step is to create report-like summaries of each community in the Leiden hierarchy, using a method designed to scale to very large datasets. These summaries are independently useful in their own right as a way to understand the global structure and semantics of the dataset, and may themselves be used to make sense of a corpus in the absence of a question. For example, a user may scan through community summaries at one level looking for general themes of interest, then follow links to the reports at the lower level that provide more details for each of the subtopics. Here, however, the focus is on their utility as part of a graph-based index used for answering global queries.
Community summaries are generated in the following way:
Leaf-level communities. The element summaries of a leaf-level community (nodes, edges, covariates) are prioritized and then iteratively added to the LLM context window until the token limit is reached. The prioritization is as follows: for each community edge in decreasing order of combined source and target node degree (i.e., overall prominance), add descriptions of the source node, target node, linked covariates, and the edge itself.
Higher-level communities. If all element summaries fit within the token limit of the context window, proceed as for leaf-level communities and summarize all element summaries within the community. Otherwise, rank sub-communities in decreasing order of element summary tokens and iteratively substitute sub-community summaries (shorter) for their associated element summaries (longer) until fit within the context window is achieved.
6. Community Summaries → Community Answers → Global Answer
Given a user query, the community summaries generated in the previous step can be used to generate a final answer in a multi-stage process. The hierarchical nature of the community structure also means that questions can be answered using the community summaries from different levels, raising the question of whether a particular level in the hierarchical community structure offers the best balance of summary detail and scope for general sensemaking questions (evaluated in section 3).
For a given community level, the global answer to any user query is generated as follows:
Prepare community summaries. Community summaries are randomly shuffled and divided into chunks of pre-specified token size. This ensures relevant information is distributed across chunks, rather than concentrated (and potentially lost) in a single context window.
Map community answers. Generate intermediate answers in parallel, one for each chunk. The LLM is also asked to generate a score between 0-100 indicating how helpful the generated answer is in answering the target question. Answers with score 0 are filtered out.
Reduce to global answer. Intermediate community answers are sorted in descending order of helpfulness score and iteratively added into a new context window until the token limit is reached. This final context is used to generate the global answer returned to the user.
Evaluation
Datasets
The authors selected two datasets in the one million token range, each equivalent to about 10 novels of text and representative of the kind of corpora that users may encounter in their real world activities:
Podcast transcripts. Compiled transcripts of podcast conversations between Kevin Scott, Microsoft CTO, and other technology leaders. Size: 1669 × 600-token text chunks, with 100-token overlaps between chunks (∼1 million tokens).
News articles. Benchmark dataset comprising news articles published from September 2013 to December 2023 in a range of categories, including entertainment, business, sports, technology, health, and science. Size: 3197 × 600-token text chunks, with 100-token overlaps between chunks (∼1.7 million tokens).
Tasks
To evaluate the effectiveness of RAG systems for more global sensemaking tasks, the authors needed questions that convey only a high-level understanding of dataset contents, and not the details of specific texts.
They used an activity-centered approach to automate the generation of such questions: given a short description of a dataset, they asked the LLM to identify N potential users and N tasks per user, then for each (user, task) combination, they asked the LLM to generate N questions that require understanding of the entire corpus. For their evaluation, a value of N = 5 resulted in 125 test questions per dataset.
Metrics
Given the multi-stage nature of the GraphRAG mechanism, the multiple conditions compared, and the lack of gold standard answers to the activity-based sensemaking questions, the authors adopted a head-to-head comparison approach using an LLM evaluator. They selected three target metrics capturing qualities that are desirable for sensemaking activities, as well as a control metric (directness) used as a indicator of validity:
Comprehensiveness. How much detail does the answer provide to cover all aspects and details of the question?
Diversity. How varied and rich is the answer in providing different perspectives and insights on the question?
Empowerment. How well does the answer help the reader understand and make informed judgements about the topic?
Directness. How specifically and clearly does the answer address the question?
For the evaluation, the LLM is provided with the question, target metric, and a pair of answers, and asked to assess which answer is better according to the metric, as well as why. It returns the winner if one exists, otherwise a tie if they are fundamentally similar and the differences are negligible. To account for the stochasticity of LLMs, each comparison is run five times and mean scores are used.
Results
The key findings were:
Global approaches consistently outperformed the standard RAG baseline approach in both comprehensiveness and diversity metrics across datasets.
When comparing community summaries to source texts using GraphRAG, community summaries generally provided a small but consistent improvement in answer comprehensiveness and diversity, except for root-level summaries.
GraphRAG offers significant scalability advantages compared to source text summarization. For low-level community summaries (C3), GraphRAG required 26-33% fewer context tokens, while for root-level community summaries (C0), it required over 97% fewer tokens.
For a modest drop in performance compared with other global methods, root-level GraphRAG offers a highly efficient method for the iterative question answering that characterizes sensemaking activity, while retaining advantages in comprehensiveness and diversity over standard RAG.
Related Work
RAG Approaches and Systems
Advanced RAG systems include pre-retrieval, retrieval, post-retrieval strategies designed to overcome the drawbacks of standard RAG, while Modular RAG systems include patterns for iterative and dynamic cycles of interleaved retrieval and generation.
Graphs and LLMs (reminder: GraphRAG =/= Graph RAG)
Use of graphs in connection with LLMs and RAG is a developing research area, with multiple directions already established. These include using LLMs for knowledge graph creation and completion, extraction of causal graphs from source texts, advanced RAG where the index is a knowledge graph or subsets/metrics of the graph structure are queried, and systems that support both creation and traversal of text-relationship graphs for multi-hop question answering. However, none of these systems use the natural modularity of graphs to partition data for global summarization like Microsoft GraphRAG does.
When (not) to use Microsoft GraphRAG
If you’re just getting started with your RAG journey, Microsoft GraphRAG is probably not for you. It comes with a pretty complex pipeline that is non-trivial to set up and maintain - not only in terms of performance, but also costs. Depending on what kind of documents you want to use and how long they are, costs can ramp up rather quickly.
If, on the other hand, you’ve already successfully deployed basic RAG systems in production and you’re confident in your ability to implement something more complex, then exploring Microsoft GraphRAG might a good idea. Just be aware that not every use case needs a complex solution.
Key Takeaways
In this article, we’ve learned that:
GraphRAG combines knowledge graph generation, retrieval-augmented generation, and query-focused summarization to generate answers based on entire text corpora.
Initial evaluations have shown substantial improvements over a standard RAG baseline for both the comprehensiveness and diversity of answers.
For situations requiring many global queries over the same dataset, GraphRAG provides a data index that achieves competitive performance to other global methods at a fraction of the token cost.
If you’ve liked this piece and want to see similar content on a regular basis, consider upgrading your subscription. “Executive Summaries” is my new paid format and I will publish at least one article every week (up to 3 if a lot of important papers are coming out in a short period of time). I will also release a practical tutorial on (Microsoft) GraphGRAG soon™.